Analytics for direct-to-consumer brands

The numbers you check every morning, on one page.

Revenue, products, customers and channels, with period comparisons, cohort retention and goals, so you can stop stitching spreadsheets together.

12 months of sample data9 analysis viewsCSV export everywhere
salesboard.app / overview
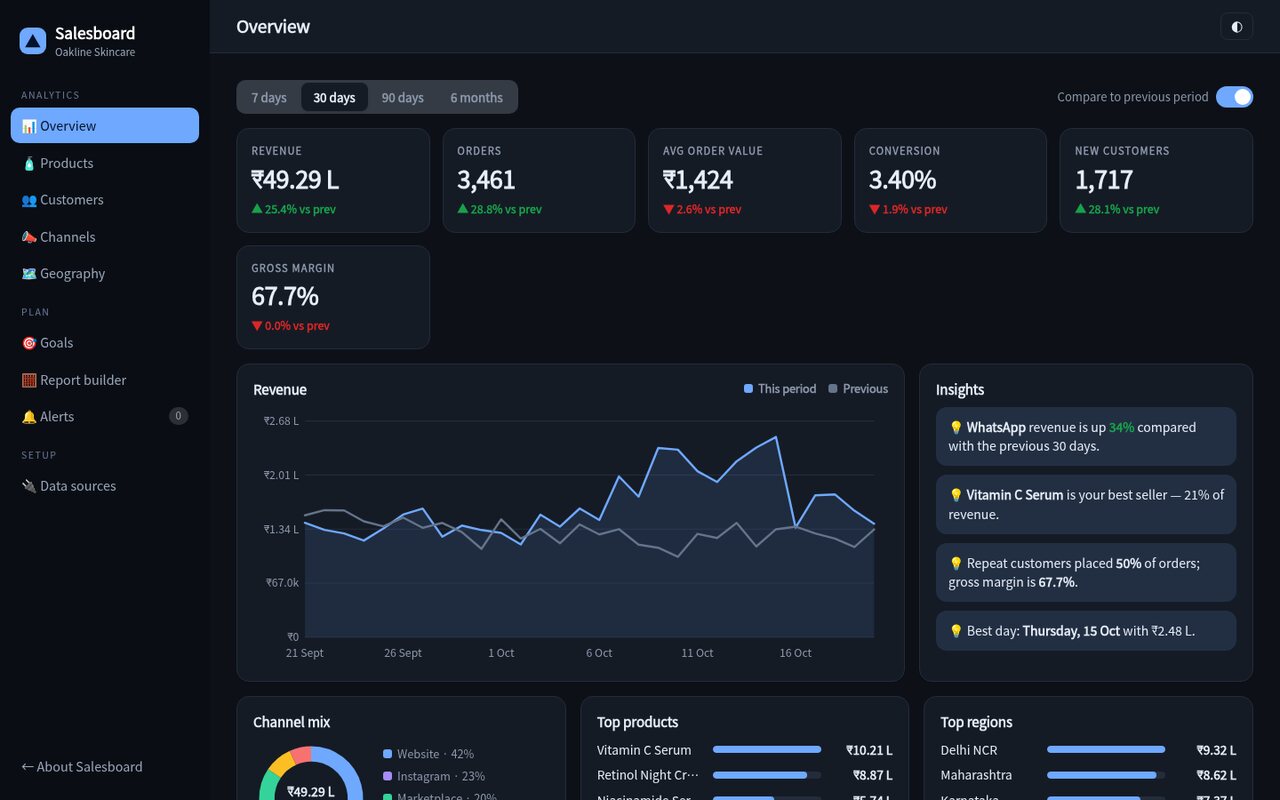
Salesboard overview: KPIs, revenue chart and insights
What you get

From "how did we do?" to "what do we do next?"

📊

KPIs with context

Revenue, orders, AOV, conversion and margin with deltas against the previous period and plain-English insights.

🧴

Product performance

Sortable product table with trend sparklines, margin and drill-down charts for every SKU.

👥

Customer cohorts

New vs returning, segments (VIP, loyal, at-risk) and a retention heatmap by first-order month.

Channel ROAS

Revenue, spend, cost per order and ROAS per channel so you know where the next rupee should go.

Goals & pacing

Monthly and per-channel targets with run-rate projections and the daily pace needed to land them.

Alerts

Rules that flag revenue drops, conversion slips and demand spikes while there's still time to react.
Customers

Know who comes back

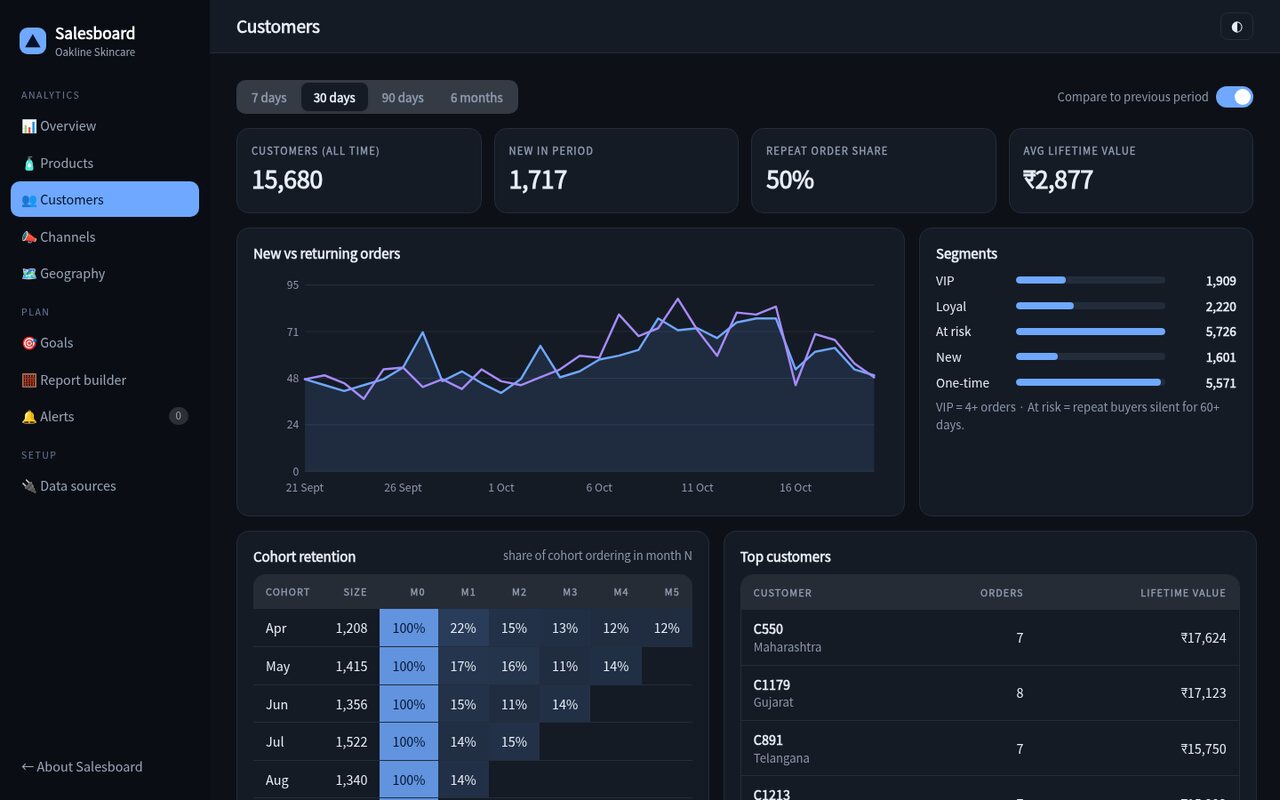
See your retention curve by cohort, find the customers who've gone quiet, and quantify how much of your revenue is repeat business.

  • Cohort retention heatmap
  • Segments: VIP, loyal, at-risk, one-time
  • Lifetime value and top customers
Open Customers
Customer cohorts and segments
Channels

Spend where it pays back

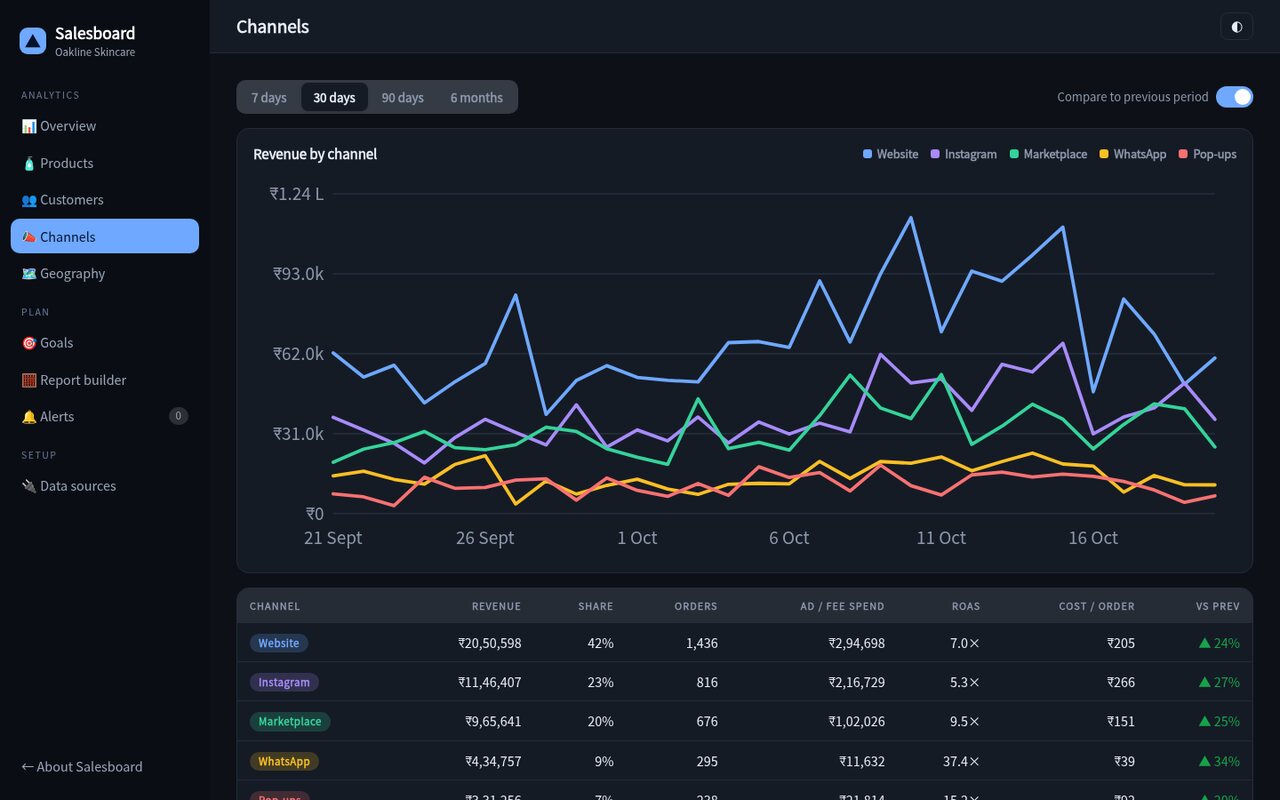
Compare Website, Instagram, marketplaces, WhatsApp and pop-ups on one table: revenue, orders, spend, ROAS and cost per order.

  • Revenue trend by channel
  • ROAS and cost per order
  • Period-over-period change
Open Channels
Channel performance
Goals

Set a target, watch it daily

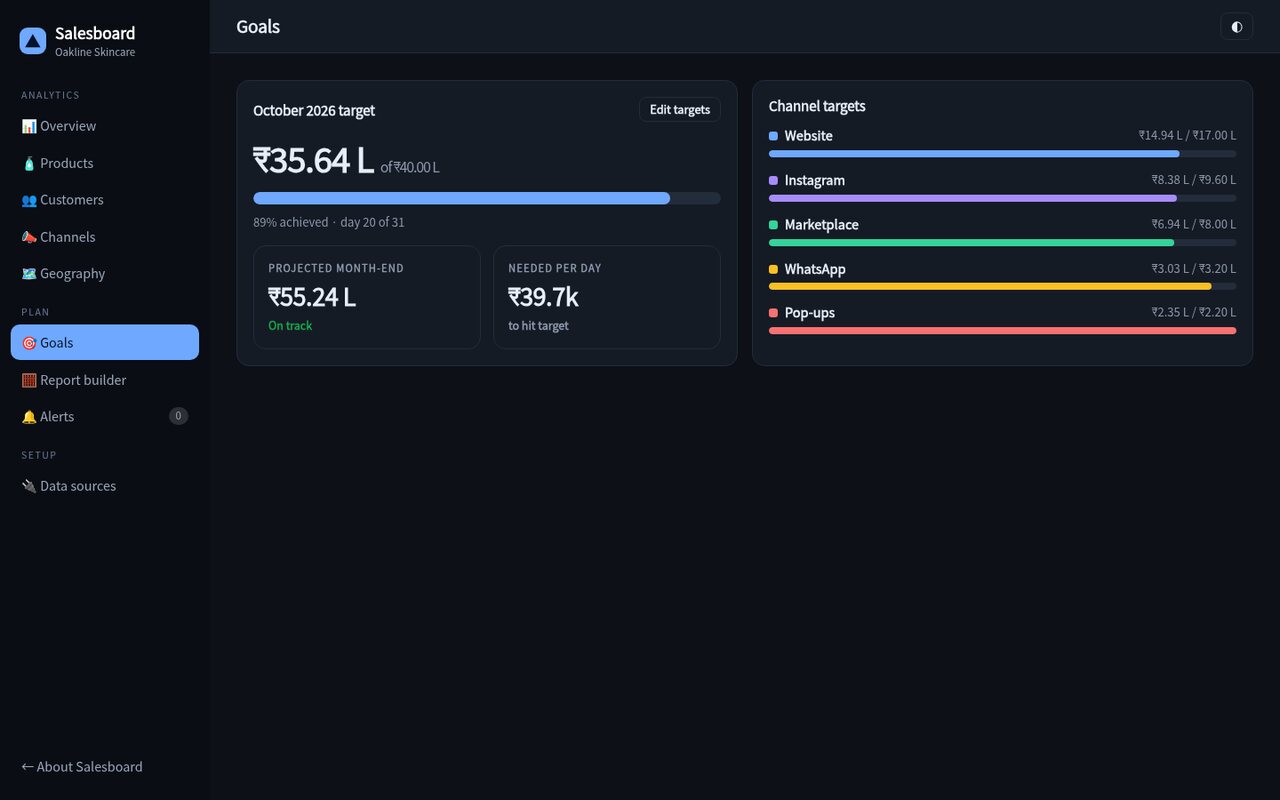
Set targets once. Salesboard projects your month-end revenue from the current run rate and tells you what each remaining day has to deliver.

  • Projected month-end revenue
  • Per-channel progress
  • Required daily pace
Open Goals
Monthly goals and progress
Live in an afternoon

How it works

Connect your sources

Shopify, Razorpay, Meta Ads and Google Analytics, or upload a CSV to start.

Review the overview

Get KPI deltas, insights and an at-a-glance view of channels, products and regions.

Set goals and alerts

Define targets and thresholds, and let Salesboard watch the numbers for you.

9views, one dashboard
12 moof history compared
0spreadsheet formulas
1 clickCSV export on every table
Pricing

Priced by revenue band, not seats

Sample pricing for this concept build.

Launch

₹1,999 / month
  • Up to ₹25 L monthly revenue
  • Overview, products, channels
  • 2 data sources
Try the demo
Most popular

Growth

₹5,999 / month
  • Up to ₹2 Cr monthly revenue
  • Cohorts, goals, alerts
  • Report builder & saved reports
  • 5 data sources
Try the demo

Scale

Custom
  • Unlimited revenue
  • Multi-brand workspaces
  • Warehouse export
Talk to us

Questions

Is the demo data real?

No, it's generated in your browser for a fictional skincare brand, with realistic seasonality, channel mix and repeat behaviour.

Which tools does it connect to?

The concept shows Shopify, Razorpay, Meta Ads, Google Analytics and Delhivery connectors; the data layer is built to accept any source via CSV or API.

Can I build my own reports?

Yes. The report builder lets you choose a metric, group by time, channel, product, category or region, and save the result.

Can I get alerts by email or WhatsApp?

The rules engine is in the demo; delivery by email, WhatsApp or Slack is a straightforward production add-on.

See your business in one screen.

Explore twelve months of sample data, filter, compare, drill in and export.

Open the live demo